Data Scraping with Cypress
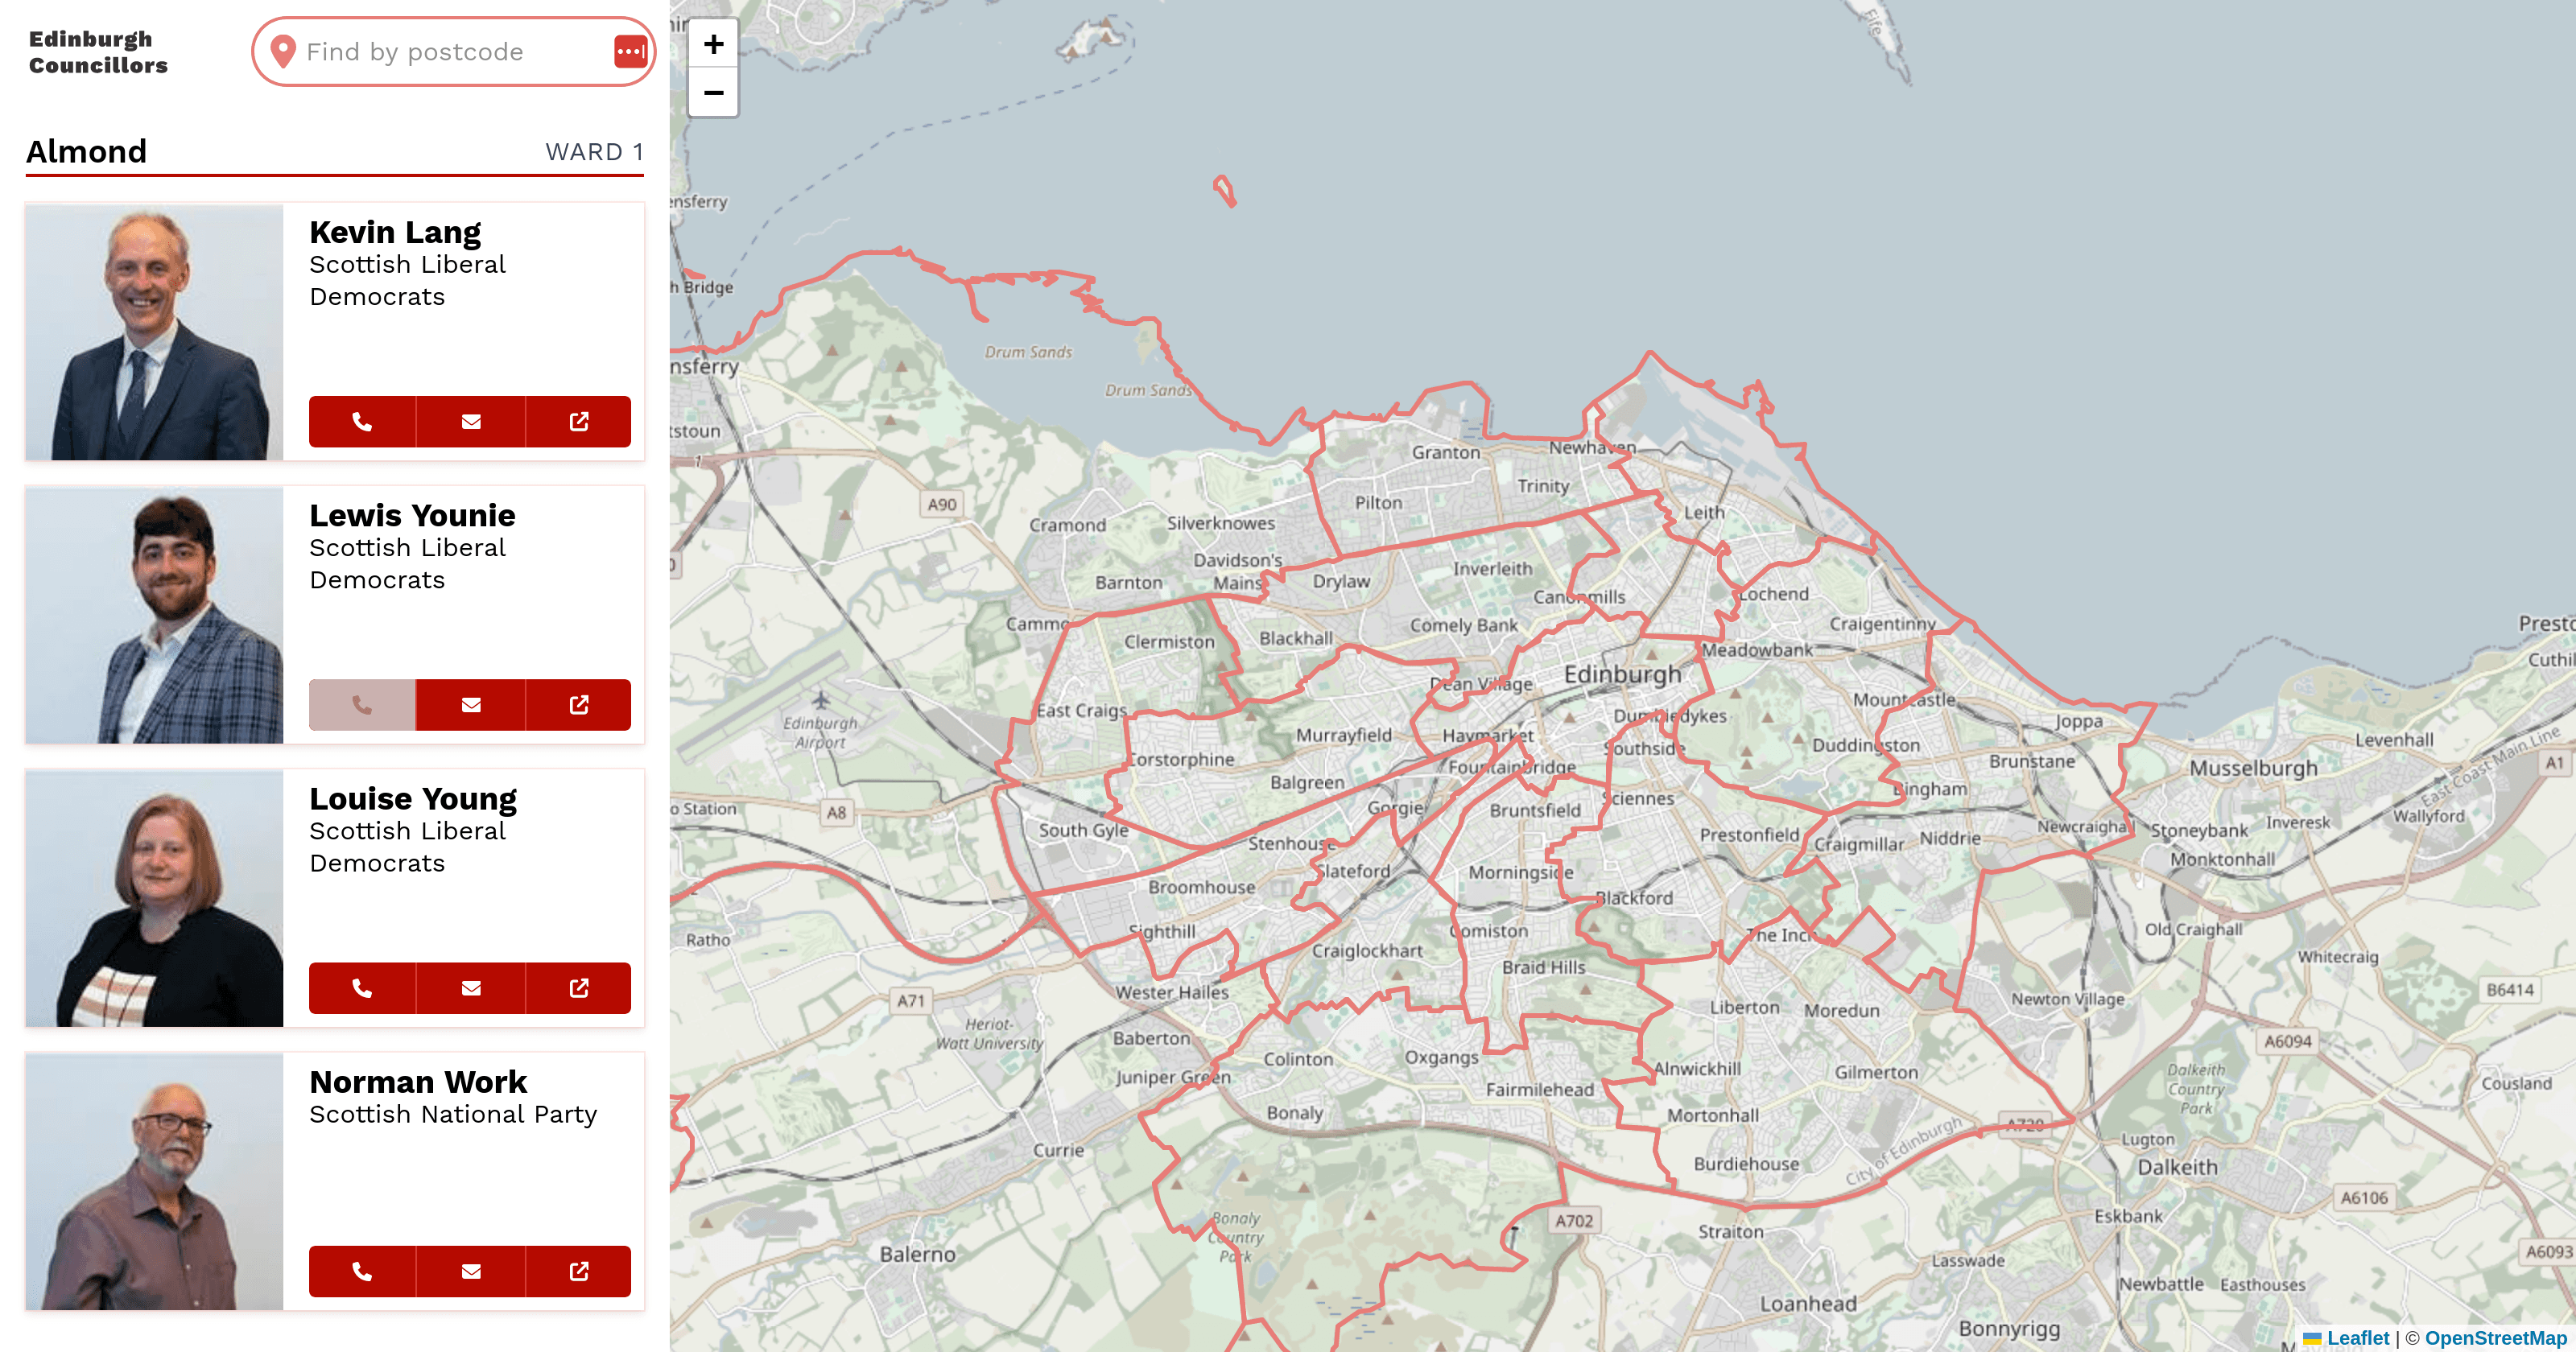
I built this prototype because I wanted something to include in my portfolio that would demonstrate my ability to work on consumer-facing, mobile-friendly web apps with an eye for design and an understanding of interactivity on touch devices. I decided to work on a small app for residents of my city to find their ward councillors. This would give me an opportunity to work with a common mobile design pattern — a fixed viewport rather than a scrollable document — and experiment with mapping tools and automated data collection.
I found a GeoJSON file that described the city's ward boundaries from Edinburgh's open data portal. The ward councillors were available from edinburgh.gov.uk, but not in a machine-readable format. I wrote a Cypress script (source), which I often use for integration testing, to scrape data from the site. The script visits the government site and collects every councillor's name, phone number, email address, photo, and website into a JSON array.
[
  {
    "name": "Almond",
    "number": 1,
    "councillors": [
      {
        "url": "https://democracy.edinburgh.gov.uk/mgUserInfo.aspx?UID=115",
        "name": "Kevin Lang",
        "phone": "01315294389",
        "email": "kevin.lang@edinburgh.gov.uk",
        "party": "Scottish Liberal Democrats",
        "photo": "images/kevin-lang.jpg"
      }
    ]
  }
]
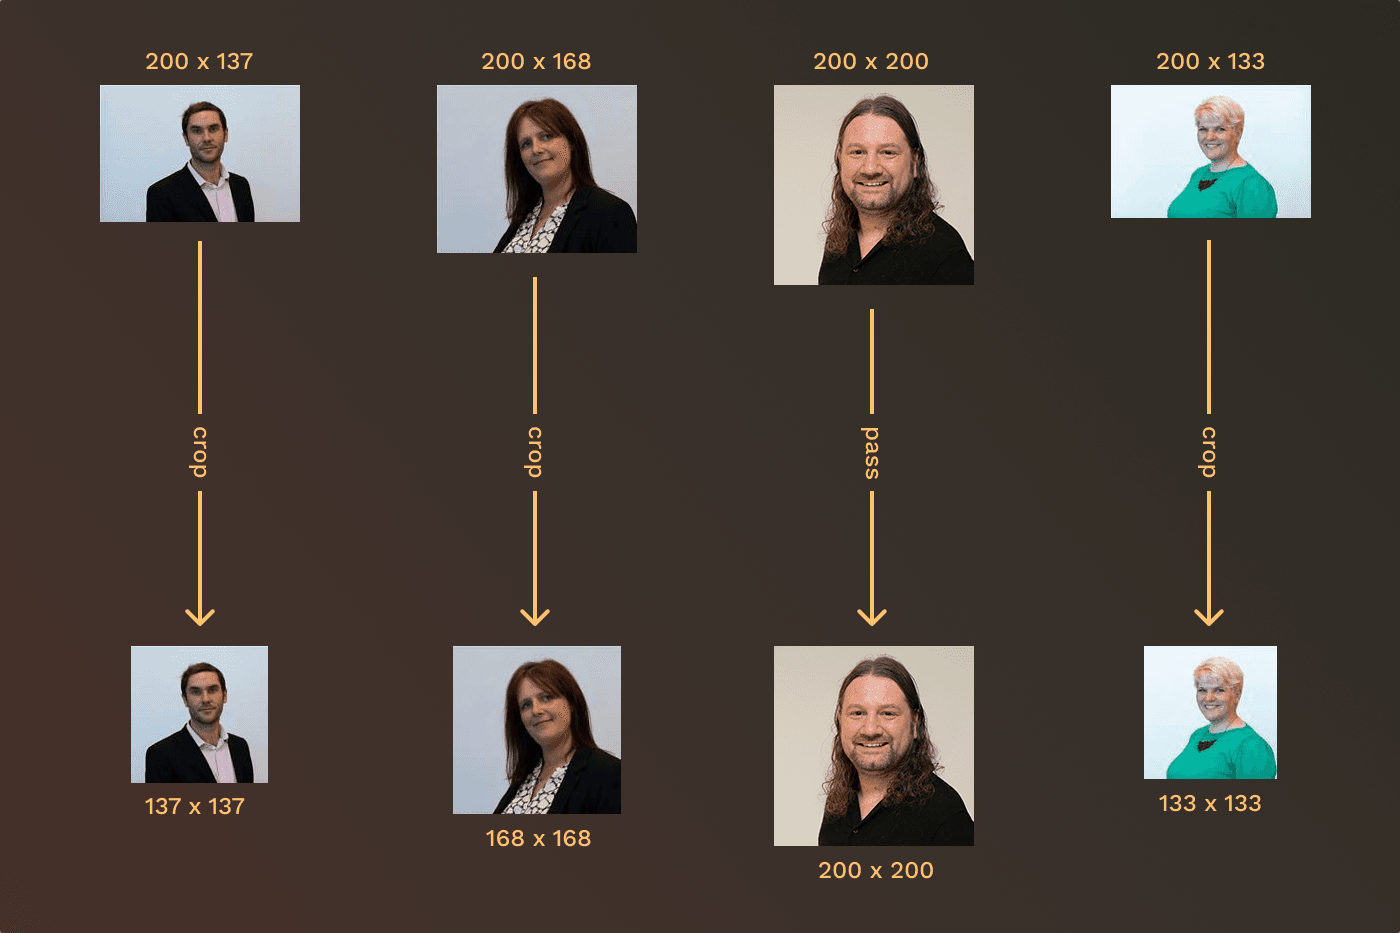
Unfortunately, the photos on the government website were all different sizes and aspect ratios. To fit them into my design, I wrote a quick Node.js script (source) to crop the photos so that they were all square.
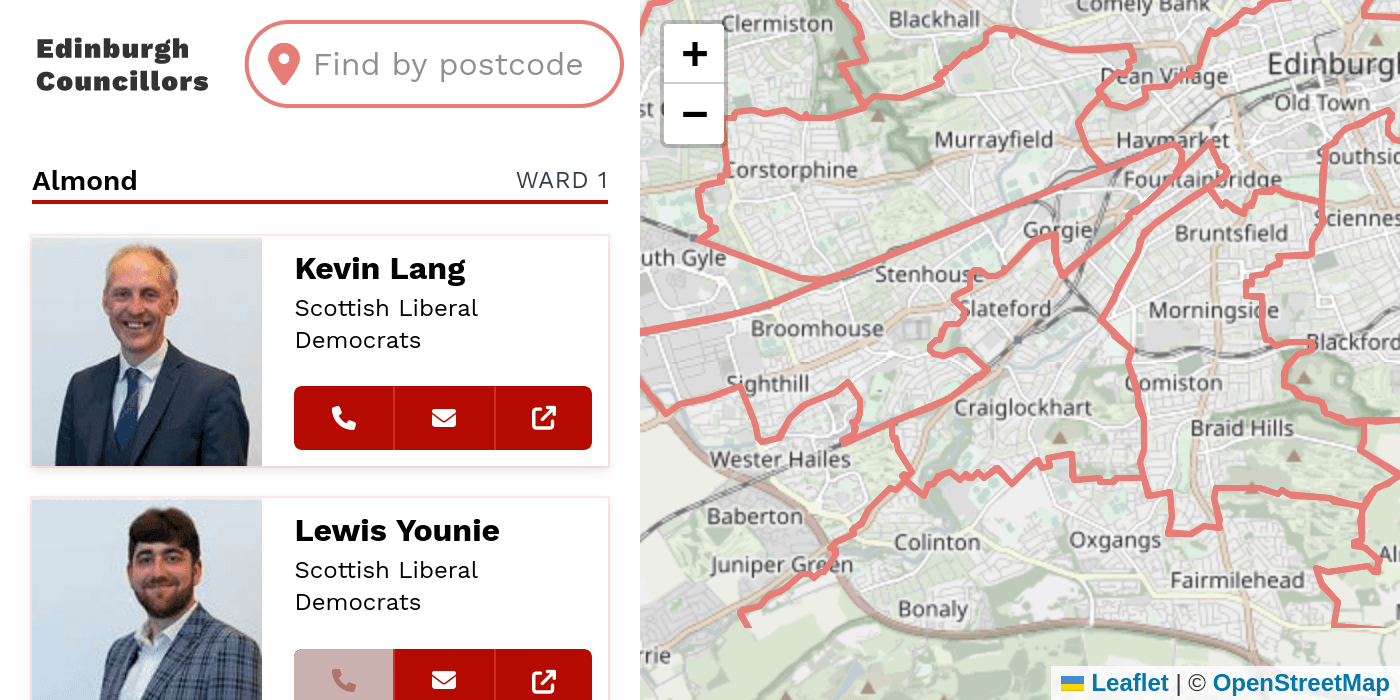
I then built the web app using Vue and Vite. I wanted a UI that would be familiar to someone using a mobile device, so I mimicked the vertical layout of Google maps on my phone. But this layout doesn't work well in landscape orientation — when the viewport is wider than it is tall.
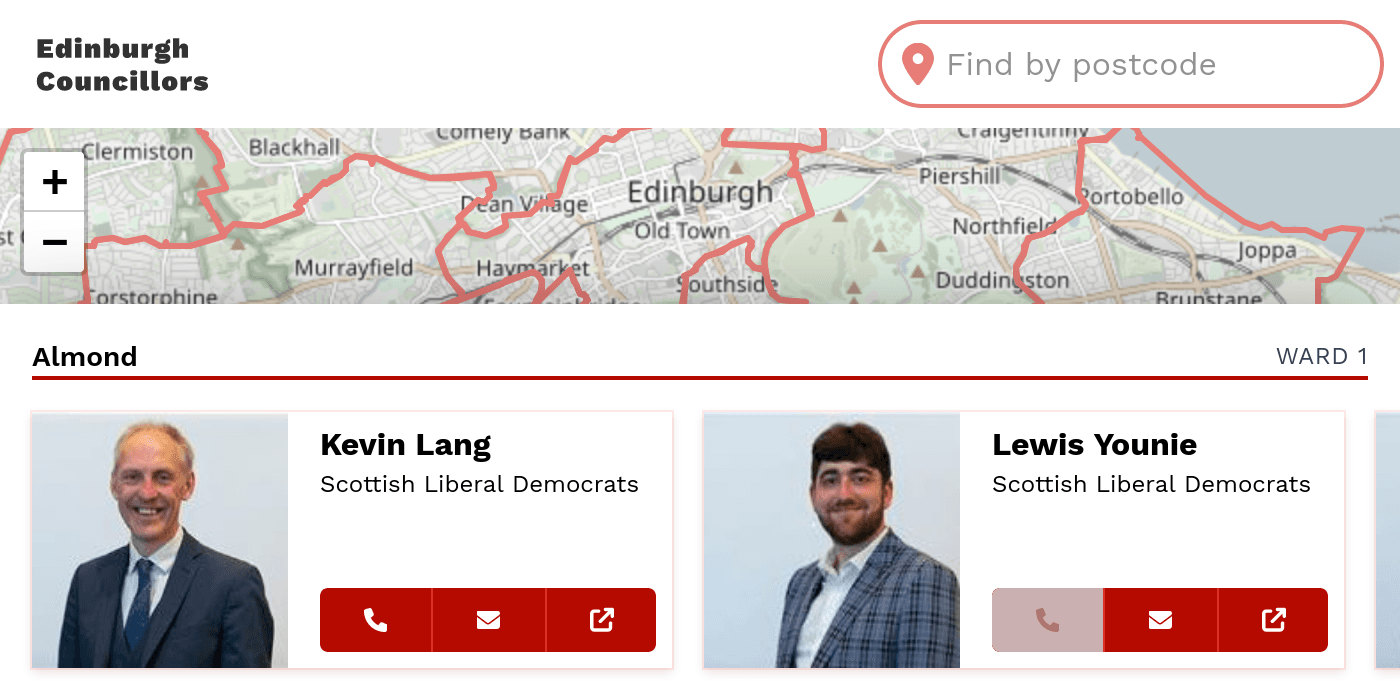
Traditional breakpoints, based on device width, weren't a great option. A screen width of 767px might represent a tablet in portrait or a phone in landscape. Rather than use a lot of media queries at set widths, I used orientation media queries to apply a different layout for viewports in portrait or landscape orientation.
.app {
  /*
   * Use default "flow" layout for
   * top-to-bottom display when the
   * viewport is taller than it is
   * wide.
   */
}

@media (orientation: landscape) {

  .app {
    display: grid;
    grid-template-columns: var(--sidebar-min-width) auto;
  }
}
This reduced the amount of CSS I had to write to account for different screen sizes, since the UI scaled pretty well once it used the appropriate layout for each orientation.
I used the popular open source mapping tool Leaflet, along with tiles from OpenStreetMaps, to render the map with the ward boundaries. There's a well-mainted Vue component (vue-leaflet) that I could have used, but I wanted to work directly with the underlying library. This way, I could use what I learned regardless of which framework or toolset I might work with in the future.
The prototype is really small, so I wrote all of the map interactions in the root component. Wards are highlighted, postcodes pinpointed, and the map is zoomed all from the same single-file-component. In a production setting, I'd expect to separate the map controller logic from the app layout component, unless I was confident the app's complexity wasn't going to grow over time.
Finally, I added integration tests to cover all the functionality. The tests are all pretty simple with this app, but I have a lot of experience working with Cypress in my work with the Public Knowledge Project. If you're interested, you can see a sample commit or view all of my commits to the test suites for OJS, OMP, and OPS.
