- Stories
- Maps
- Data Visualization
OJS Usage
I built an interactive 3D globe to showcase the Public Knowledge Project's longitudinal research on how countries use OJS, the largest scholarly publishing software in the world.
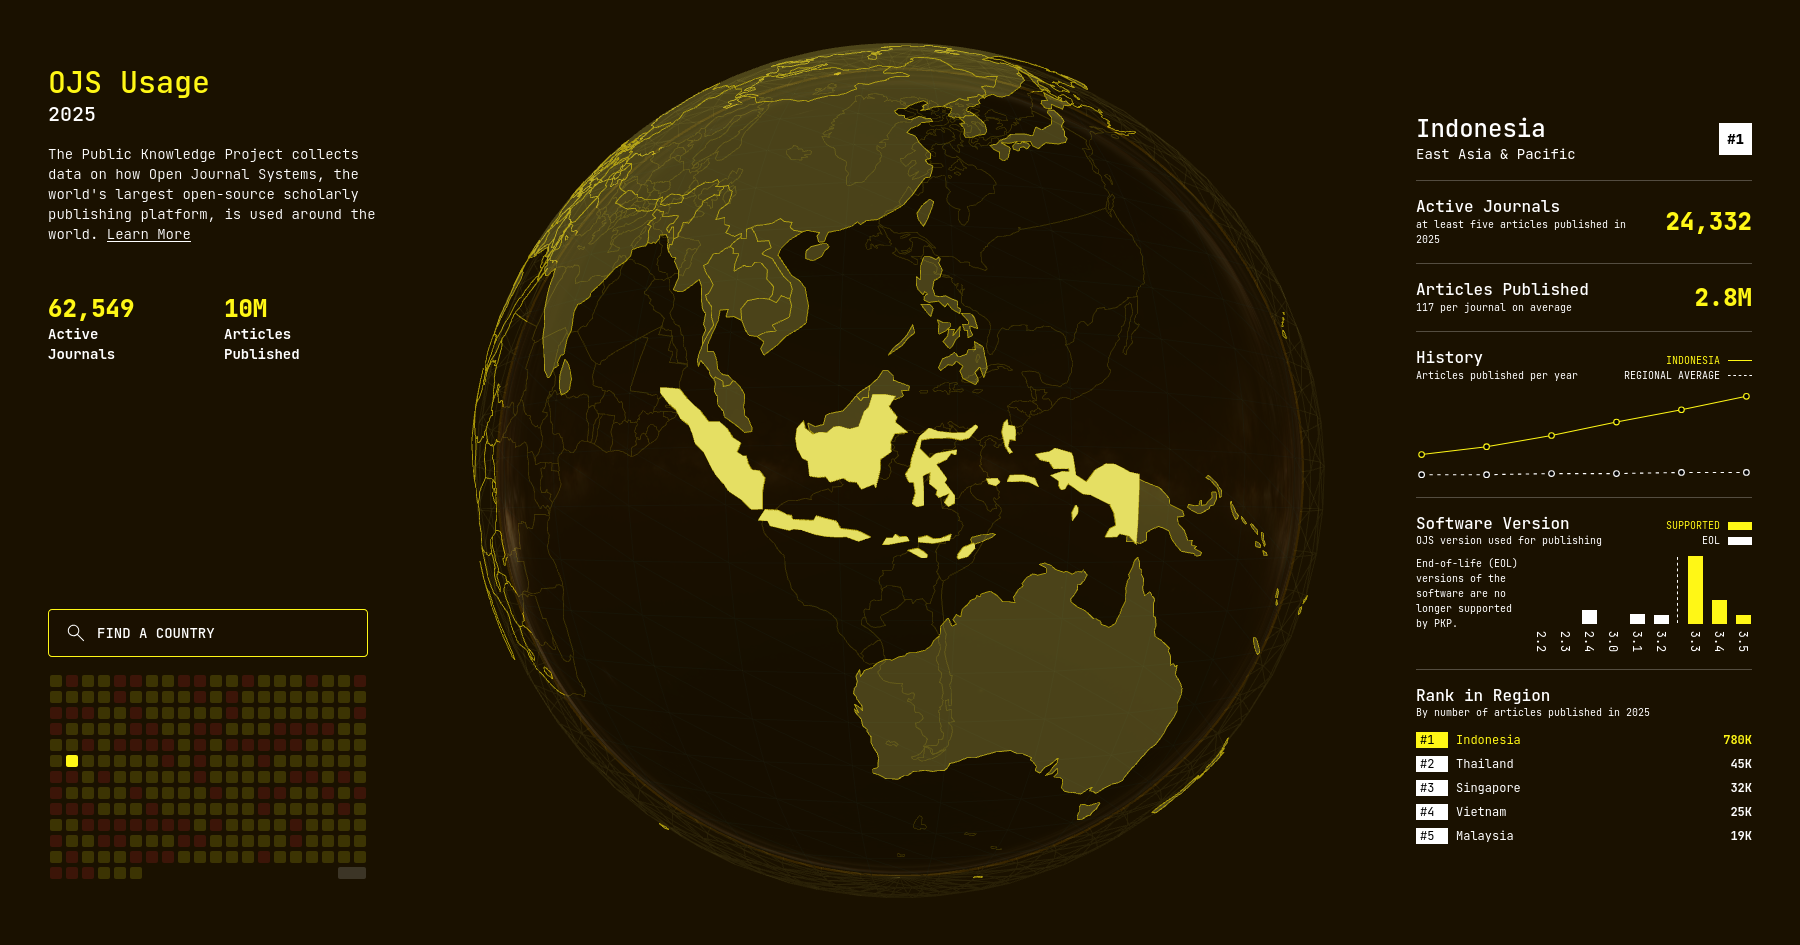
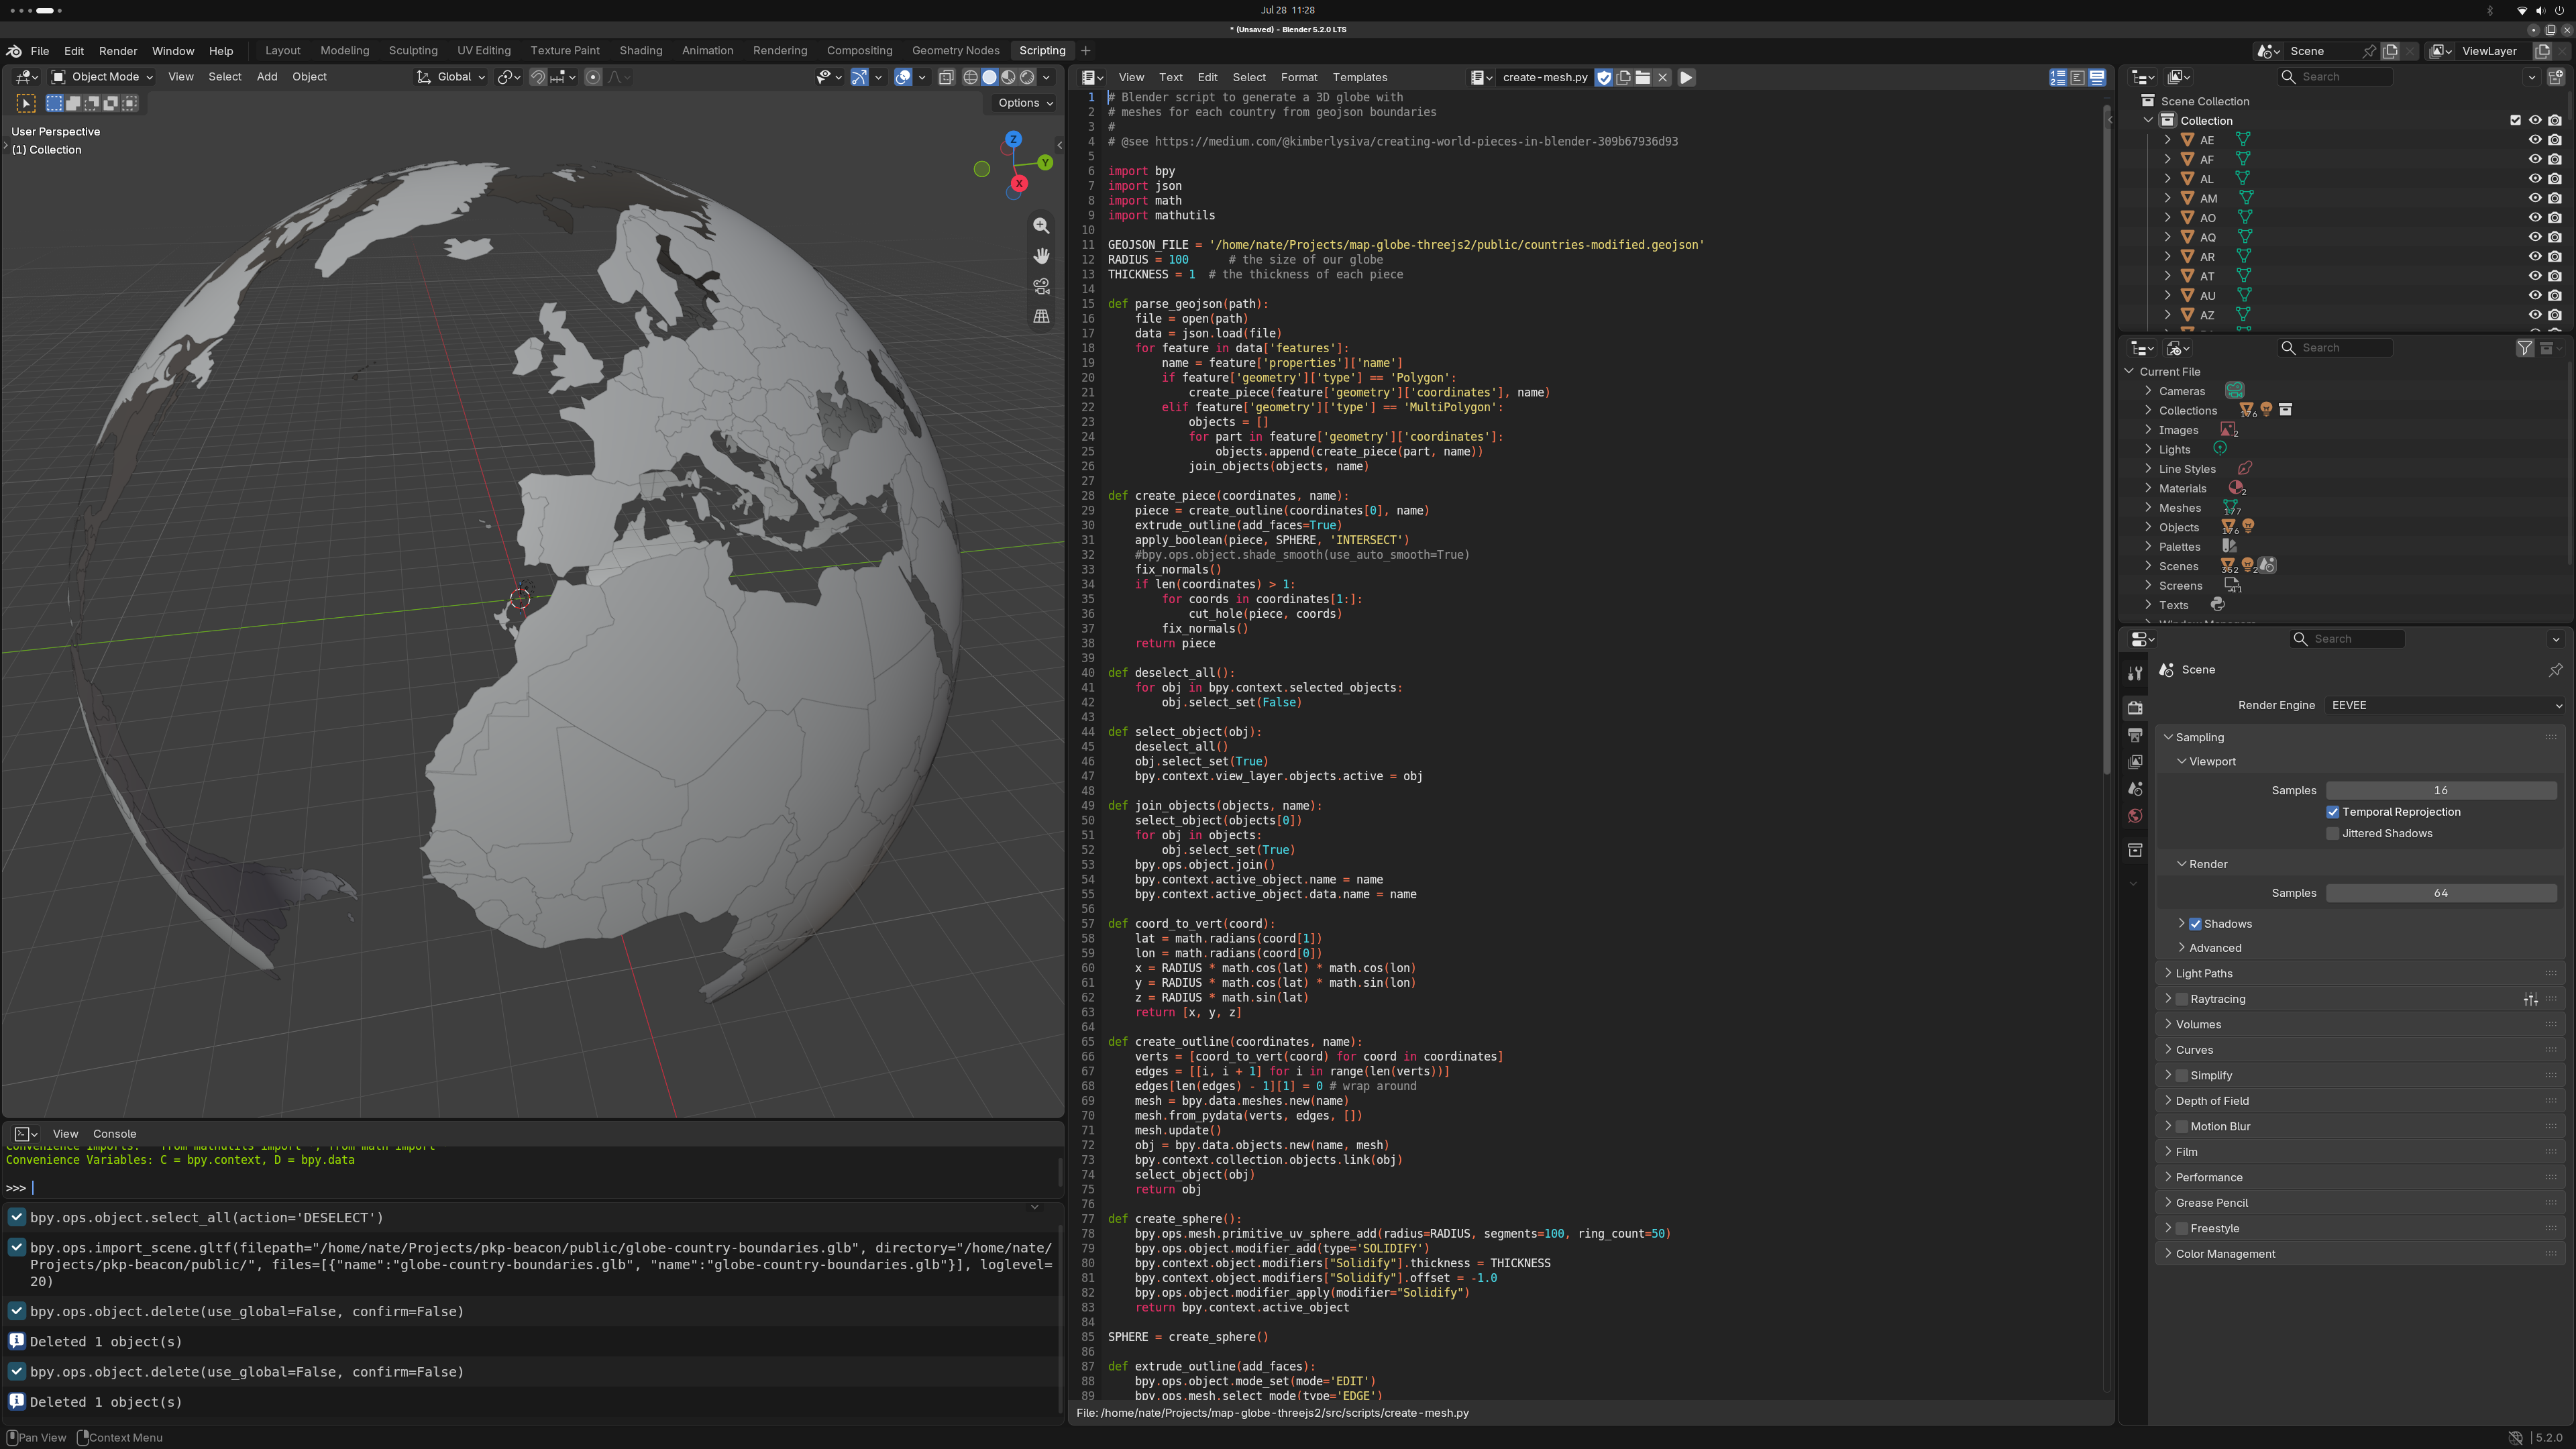
I adapted an existing Blender script to transform the national boundaries of a Geojson file into a curved globe, and then remove back faces to create the appearance of a flat, digital projection.
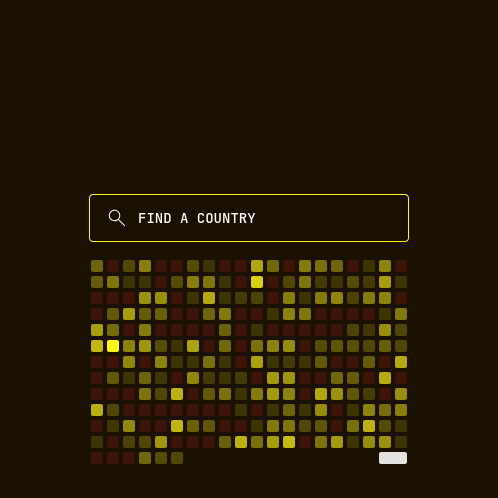
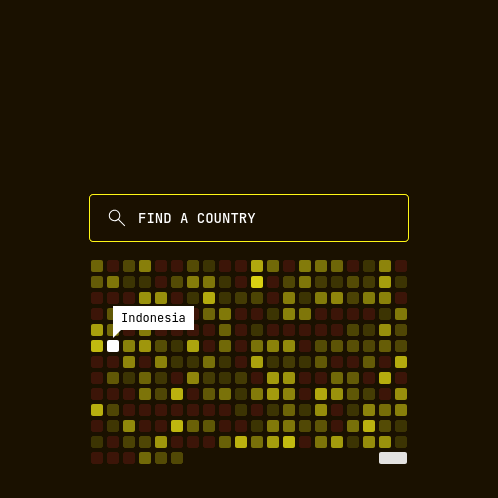
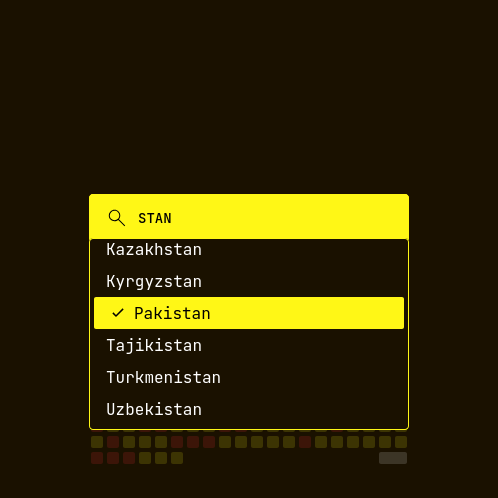
Users can click on the globe, search with autocomplete, or select from the heatmap to view national data.
Scholarly Publishing Software
I worked with the Public Knowledge Project for nearly a decade, where I was a co-lead developer on OJS.